

1. Sustainability and sustainable development
Sustainability and sustainable development are extremely topical issues for modern society. The concept of sustainability was brought to the attention of humanity during the 20th century, when the increasing development of some countries originated environmental concerns and stimulated humans to gain a deeper understanding of natural resources, their dynamics and impact of overexploitation.
Unsustainable impacts of human development are part of the history of humanity since prehistoric times. Indeed, ancient civilisations experienced local problems related to societal evolution. A relevant example is ancient Athens where efficient systems were built to supply water and to manage wastes. To understand how sustainability emerged as a global concern we have to go back to the 18th century. At that time, the industrial revolution, that took place between the 18th and the 19th century, marked a tremendous shift in the societal assets and standards of living of humanity. It also induced an unprecedented rise in the rate of population growth. Economic growth spread to all regions of the world during the twentieth century, when world gross domestic product (GDP) per capita quintupled. On the other hand, the quality of the environment immediately started to suffer from the above sudden development. The first unintended consequence of the industrial revolution was the deterioration of air quality.
The list of the unforeseen and seemingly unsustainable impacts of societal development is long. To mention only a few:
- The development of intensive agriculture implied a marked increase of water demands for irrigation and caused pollution of surface water and groundwater due to fertilisation, therefore originating the need for efficient water resources management strategies. Note that this impact is not directly connected to energy production. It is rather related to the increasing need of water for food, which is another consequence of societal development.
- The construction of dams and river barrages for producing energy and delivering water for irrigation and civil use induced extensive deprivation of river flows, therefore causing concerns for river ecology and morphology, groundwater replenishment, and so on. These concerns originated the concept of environmental flow, which is defined as the quantity, timing, and quality of water flows required to sustain freshwater and estuarine ecosystems and the human livelihoods and well being that depend on them.
- The increased demands for energy, which is today mainly produced by burning fossil fuels, is originating concerns related to the sustainability of energy production.
- The concentration of carbon dioxide (CO2) in the atmosphere is markedly increased during the 20th century. Such increase may be due to humans, in particular to burning fossil fuels. It may have caused the global warming that was observed since the mid of the 20th century, which is in turn inducing other forms of climate change.
- Concentration of people in cities caused unsustainable pollution induced by human wastes, that were released in surface water and groundwater with concentration beyond the self regulating capacity of rivers and groundwater bodies.
The above unintended consequences of the industrial revolution and societal development pointed out, for the first time in our history, that human development may not be sustainable by the Earth system. The awareness of the above threats stimulated the development of a collective consciousness of the necessity to better understand and protect the environment in its broadest sense.
2. The emergence of climate change
Climate change can be defined as a significant and long term change in the statistics of weather patterns. With "long term" we mean a period ranging from several decades to millions of years. If we want to focus on a scientific approach it is important to be very rigorous with definitions, which we have to fully understand. Therefore, it is important to make clear the following terminology:
- Weather can be defined as the combination of meteorological behaviours at a given location and time. Examples of meteorological behaviours are temperature, wind direction and speed, amount and type of precipitation, sun shine hours, etc. The time scale of weather ranges from a very short period up to several days.
- Climate can be defined as the long term (conventionally we refer to minimum time span of about 30 years) distribution of statistics of weather conditions for a specific region.
- Statistics of data describe the macroscopic behaviours of data. Examples of statistics of data are their average, their variability, their tendency to include extremes. In the broadest sense, statistics is the discipline that concerns the collection, organization, analysis, interpretation, and presentation of data.
Therefore, within a scientific approach when we say that "Climate change can be defined as a significant and long term change in the statistics of weather patterns" we mean that we collected data on weather (like for instance local temperature during an observation period) for a long period (like 30 years), we computed the statistics of these data - for example the average over a given time period, like monthly average - and we are allowed to say that there is climate change if these statistics exhibit a significant change over time. Climate change may be local or global. Local changes of climate are not less important with respect to global one. A relevant example of local climate change which is causing several problems is the urban heat island effect. See Figure 1 and 2 and Papalexiou et al. (2018).

Figure 1. An example of an urban heat island. Temperatures of Tokyo go up higher than those of the surrounding area. By Cory, CC BY 2.1 jp, https://commons.wikimedia.org/w/index.php?curid=2112738
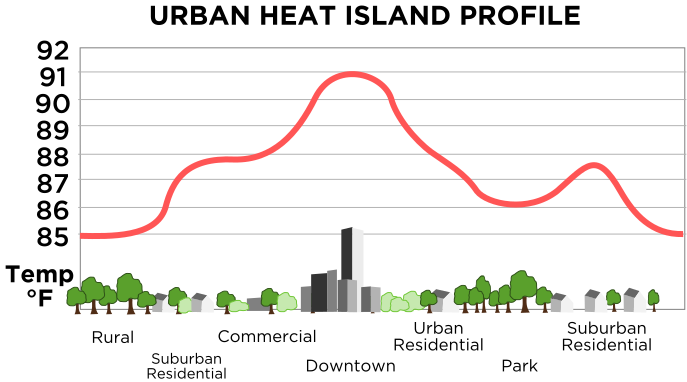
Figure 2. Mechanism of the urban heat island effect: the densely-built downtown areas tend to be warmer than suburban residential areas or rural areas. By TheNewPhobia - Own work, Public Domain, https://commons.wikimedia.org/w/index.php?curid=5263244
The urban heat island effect is causing local increases of temperatures which in turn trigger a circular feedback with the installation of air conditioning facilities, which provoke a further increase of temperature. An contribution by Papalexiou et al. (open access) shows that
A global increase of 0.19°C per decade during the past 50 years (through 2015) accelerated to 0.25°C per decade during the last 30 years, a faster increase than in the mean annual temperature. Strong positive 30-year trends are detected in large regions of Eurasia and Australia with rates higher than 0.60°C per decade. In cities with more than 5 million inhabitants, where most heat-related fatalities occur, the average change is 0.33°C per decade, while some east Asia cities, Paris, Moscow, and Houston have experienced changes higher than 0.60°C per decade.
For more details see here.
3. Forcings and feedbacks
Forcings are the drivers of climate dynamics. The most important ones are solar irradiance, greenhouse gas emissions and the concentration of aerosols, dust, smoke and soot.
- Solar irradiance is the power per unit area (surface power density) received from the Sun in the form of electromagnetic radiation. Solar irradiance is measured in watts per square metre (W/m2) in SI units. The Sun has an 11-year sunspot cycle, which causes a very small variation in the Sun’s output reaching Earth. The solar cycle is incorporated into climate models. Measurements of solar irradiance are affected by uncertainty, especially those going back to the far past. Globalmaps of solar irradiance are available at the Global Solar Atlas by the World Bank.
- Greenhouse gases are responsible for the greenhouse effect. The most important greenhouse gas is carbon dioxide (CO2). Greenhouse gases are released by human activities, but also by oceans that are carbon sinks. With increasing global temperature oceans contribute to the increase of CO2 concentration. CO2 emissions per capita due to burning of fossil fuels and cement production are shown in Figure 3. Figure 4 shows predictions of future emissions for different emission scenarios.
- Aerosols, dust, smoke and soot are released by human activities, volcanic eruptions and other sources. Their net effect is cooling. It is believed that the cause of global cooling that occurred during the second half of the XXth century was mainly caused by aerosol effects.
Feedbacks are processes that can either amplify or reduce the effects of climate forcings. A feedback that increases an initial warming is called a "positive feedback." A feedback that reduces an initial warming is a "negative feedback." See Figure 5. NASA lists the most important feedbacks as follows:
- Clouds. Clouds have an enormous impact on Earth's climate, reflecting about one-third of the total amount of sunlight that hits Earth's atmosphere back into space. Even small changes in cloud amount, location, and type could have large consequences. A warmer climate causes more water to be held in the atmosphere, leading to an increase in cloudiness and altering the amount of sunlight that reaches Earth's surface. Less heat could get absorbed, which could slow the increased warming. Conversely, changes in cloud cover could lead to faster and greater warming. This is an area of ongoing research.
- Precipitation. Global climate models show that precipitation will generally increase due to the increased amount of water held in a warmer atmosphere. Some regions may dry out instead. Changes in precipitation patterns may present both positive and negative changes in plant growth.
- Forest greening and browning. Natural processes, such as tree growth, remove about half of human carbon dioxide emissions from the atmosphere every year. Scientists are currently studying where this carbon dioxide goes. The delicate balance between the absorption and release of carbon dioxide by the ocean and the world’s great forested regions is the subject of research by many scientists. There is some evidence that the ability of the ocean or forests to continue absorbing carbon dioxide may decline as the world warms, leading to faster accumulation in the atmosphere. Carbon dioxide uptake by plants is unable to offset emissions from human activities.
- Ice albedo. Ice is white and very reflective, in contrast to the ocean surface, which is dark and absorbs heat faster. As the atmosphere warms and sea ice melts, the darker ocean absorbs more heat, causes more ice to melt, and makes Earth warmer overall. The ice-albedo feedback is a very strong positive feedback.
- Water vapor. The most abundant greenhouse gas, it acts as a feedback to amplify climate warming forcings. Water vapor increases as Earth's atmosphere warms, making it an important feedback mechanism to the greenhouse effect.
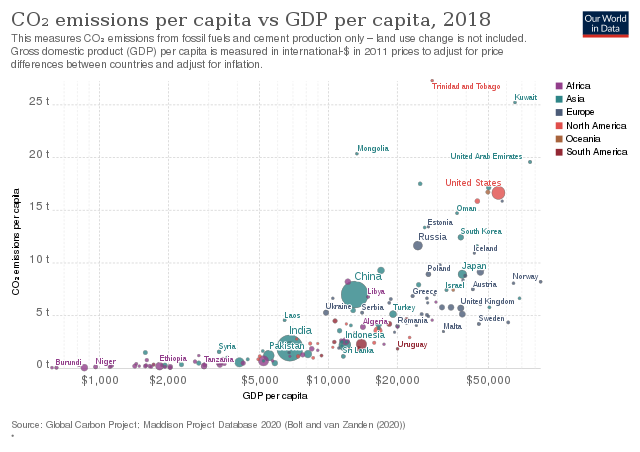
Figure 3. CO2 emissions vs GDP. From Hannah Ritchie and Max Roser (2020) - "CO₂ and Greenhouse Gas Emissions". Published online at OurWorldInData.org. Retrieved from: 'https://ourworldindata.org/co2-and-other-greenhouse-gas-emissions' [Online Resource], CC BY-SA 4.0, https://creativecommons.org/licenses/by-sa/4.0, via Wikimedia Commons
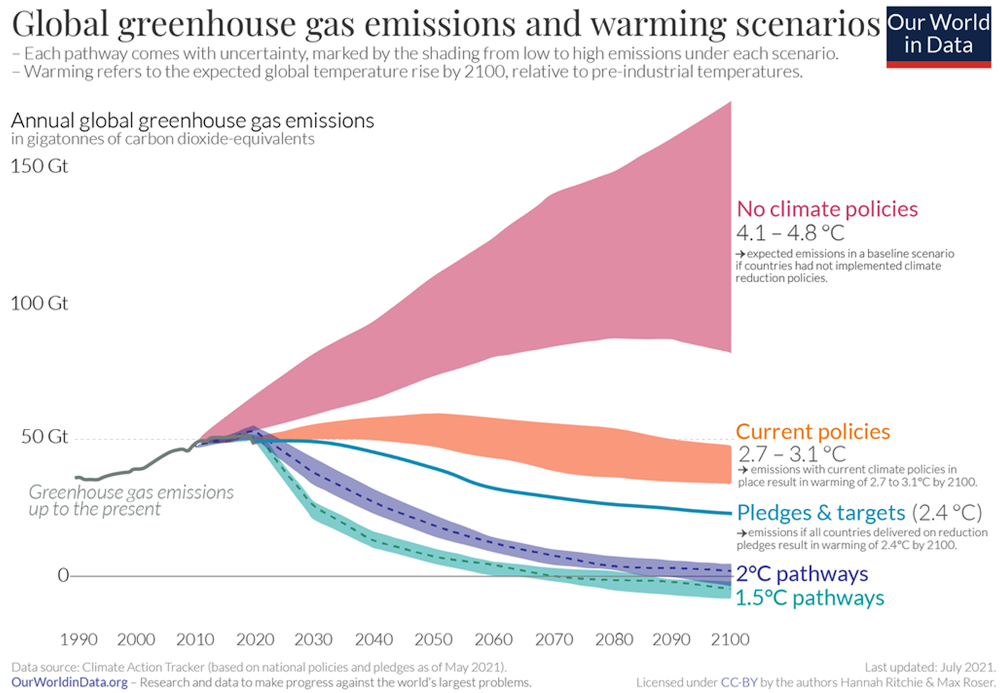
Figure 4. Projections of future greenhouse gases emissions. From "Our World in Data".
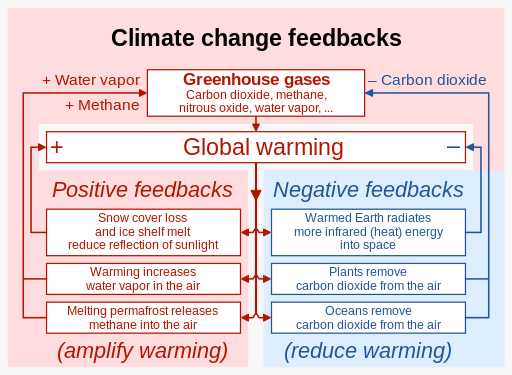
Figure 5. Block diagram showing feedbacks affecting global warming and climate change. By RCraig09, CC BY-SA 4.0 <https://creativecommons.org/licenses/by-sa/4.0>, via Wikimedia Commons
Box: computation of statistics and use of statistical software
Let us suppose that we measured daily max temperature at a location for a duration of 10 days (such duration is not long enough to assess climate, we adopt it for the sake of providing a simple example) and collected the following numbers: 20, 22, 17, 16, 25, 27, 23, 23, 20, 19. We can use the R software to draw a graph of the data, by using at the R console the commands:
- >temperature=c(20, 22, 17, 16, 25, 27, 23, 23, 20, 19)
- >plot(temperature, xlab="Days", ylab="Daily maximum temperature", type="b",col="red")
therefore obtaining the graph in Figure 6.

Figure 6. Plot of the temperature data
Then, we can compute basic statistics with the instructions:
- Average: >mean(temperature)
- Standard deviation: >sd(temperature
Climate change may be caused by several factors including atmospheric and oceanic processes, variations in solar activity, plate tectonics and volcanic eruptions. Climate change can be caused by human-induced alterations of the natural environment. The term "climate change" is often used to describe human-specific impacts. From a scientific point of view we have to rigorous and therefore refer to all possible causes of climate change.
Box: Climate change attribution
A relevant research question is climate change attribution. The aim is to recognize to what extent humans are responsible for the recent climate change. There is no doubt that the human activity is impacting climate, but for drawing technical conclusion it is necessary to quantify the magnitude of human impact versus natural variability of climate. The following two videos give a glance of human impact on climate and natural variability:
Early concerns related to climate change began in the early 19th century when ice ages and other natural changes in paleoclimate were first hypothesised and the greenhouse effect was first identified. In the late 19th century, for the first time scientists outlined that emissions of gases and pollution by humans could alter the climate at local and global scale. In the 1960s, the evidence for the warming effect of carbon dioxide gas became increasingly convincing. Some scientists also pointed out that human activities that generated atmospheric aerosols (e.g., "pollution") could have cooling effects as well. In fact, during the 1970s scientists conjectured an imminent cooling of the Earth, that was suggested by declining temperatures at several locations. Global cooling was attributed to orbital changes and increasing human emissions of aerosols. As additional data became available through time, the increasing global temperature during the next decades falsified the conjecture.
Today scientists substantially agree that human activities are impacting climate at both the local and global level. However, as more and more data and scientific results become available it is increasingly clear that natural variability is still poorly understood although it may potentially cause long lasting impacts and environmental disasters. Relevant example, among others, are offered by the so called Dust Bowl in the United States and Canada during the 1930s, the 2000s Australian drought and the droughts in California.
4. Science of climate change
Climate change is a topical issue worldwide that ranks high in the agenda of politicians and policy makers. It is widely covered by the media as it is the subject of much public interest. Still, little is known about the underlying science and the related uncertainties. Actually, it is a multidisciplinary science focusing on a very complex systems of tightly interacting processes, that we do not yet fully understand. Science of climate change is a very active field of research. The scientific literature is very prolific in several different disciplines so that it is difficult to elaborate an up-to-date picture of the available knowledge to adequately support the design of climate actions. Such lack of support, along with the seeming unsustainability of some proposed solutions, often causes that climate actions are delayed or given low priority. In view of the actual urgency of climate actions it is therefore important to adopt a pragmatic approach by elaborating a clear idea of the targets, the appropriate methods and the relevant disciplines and expertise to involve. As far as methods are concerned, there is still little technical knowledge regarding the design climate change mitigation and adaptation strategies; namely, technology transfer from climate science to policy makers through engineering science needs is still a gap that we need to fill to provide forward looking guidelines for technical design. The reason for the above gap is the little connection between climate and engineering science.
Engineering science is a scientific discipline that provides innovative knowledge and methods to support engineering design. It is strictly related to mathematics, physics, biology and chemistry, but involves also specific technical knowledge. It also includes arts, humanities, social sciences, and the professional knowledge and solutions regarding the global challenges for modern society. It is therefore a discipline that has a key role in the context of the climate emergency. Engineering scientists possess interdisciplinary scientific and technical knowledge to propose innovative climate actions to support mitigation of climate change and adaptation to its impacts through enabling new technologies. See, for instance, the description of the Engineering Science and Mechanics programme of the Penn State College of Engineering. Science of climate change is an indispensable support for identifying suitable climate actions and therefore the involvement of the proper expertise is an essential ingredient to success. At the same time, in view of the global dimension of the related problems and the consequent political and media attention, a rigorous and transparent approach is needed with a clear illustration of the related uncertainties.
In climate science consensus is often called into play to provide support to assumptions and theories. The call for consensus is not new to science. When it is not possible to provide firm support to a theory, which is related to relevant issues that have substantial implications, scientists tried to support its validity by reaching consensus. A relevant example is the theory of evolution through natural selection, which is also supported by an overwhelming scientific consensus; it is one of the most reliable and empirically tested theories in science. On the other hand, consensus on a theory should not be confused with a rigorous demonstration of its validity and should lead to neglecting or underestimating its uncertainty.
The late physician, producer, and writer Michael Crichton during a lecture at the California Institute of Technology in 2003, expressed a view on consensus that was widely echoed in the scientific community:
I want to pause here and talk about this notion of consensus, and the rise of what has been called consensus science. I regard consensus science as an extremely pernicious development that ought to be stopped cold in its tracks. Historically, the claim of consensus has been the first refuge of scoundrels; it is a way to avoid debate by claiming that the matter is already settled. Whenever you hear the consensus of scientists agrees on something or other, reach for your wallet, because you’re being had. Let’s be clear: the work of science has nothing whatever to do with consensus. Consensus is the business of politics. Science, on the contrary, requires only one investigator who happens to be right, which means that he or she has results that are verifiable by reference to the real world. In science consensus is irrelevant. What is relevant is reproducible results. The greatest scientists in history are great precisely because they broke with the consensus. There is no such thing as consensus science. If it’s consensus, it isn’t science. If it’s science, it isn’t consensus. Period. In addition, let me remind you that the track record of the consensus is nothing to be proud of. Let’s review a few cases.... [omissis]
It is clear that the theory behind climate science is currently under development and several research questions are still open and debated and consensus is sought. From the point of view of engineering and therefore the design of climate actions the so-called global warming controversy (namely, the question of whether global warming is occurring, how much has occurred in modern times, what has caused it) is not very relevant. Engineers are used to deal with human impact on the environment as an unavoidable consequence of societal and environmental development and the historical effort by humans to reach a compromise with the environment to ensure better living conditions. The task of engineers is to devise actions to exploit the benefits of human impact and to minimise the unavoidable downsides. From the point of view of engineering it is clear that human are increasingly impacting climate at the global level, but still several research questions are still open, like for instance:
- The interaction between human induced climate change and natural climate variability;
- Uncertainty assessment of climate simulations for the sake of engineering practice;
- The capability of climate simulations to reliably reproduce the frequency of extreme events, therefore avoiding underestimation of extremes;
- The capability of climate simulations to estimate the risk related to the so-called black swans and tipping points;
- Estimation of actions and forcing to support improved climate actions and sizing of infrastructures to ensure climatic resilience.
Variability is a relevant question because it is directly related to the occurrence of extreme events and therefore catastrophes and it is different to determine its drivers and its evolution in the future. Regarding future scenarios, it is extremely important not to underestimate natural variability and its evolution in the next decades in order to get a correct evaluation of the probability of occurrence of extremes under climate change.
I gave a presentation to emphasise the unknowns of natural variability at the 27th IUGG General Assembly titled "The Unsolved Rebus of Natural Variability". The presentation is available for download at this page. It is technical and therefore I suggest to focus on the concepts rather than the details. I believe it provides a picture of what we still do not know about climate dynamics.
Box: Tipping points
A tipping point for a given system (like the climate systems) is a state of the system such that a tiny change of the state itself leads to a new equilibrium state. The tiping point may be reversible or not. Tipping points may be induced by positive (self-reinforcing) feedbacks. Components of the Earth system that may pass a tipping point have been referred to as tipping elements. (see Figure 7). Tipping elements are found in the Greenland and Antarctic ice sheets, possibly causing tens of meters of sea level rise. The IPCC states that the precise levels of climate change sufficient to trigger a tipping point remain uncertain, but that the risk associated with crossing multiple tipping points increases with rising temperature.

Figure 7. Tipping elements in the Earth's climate system, based upon Lenton et al. (2008). By CodeOne (blank map), DeWikiMan (additional elements), https://en.wikipedia.org/wiki/File:Climate-tipping-points-en.svg.
Figure 8 depicts examples of social tipping points which can trigger abrupt changes in the social system. It also depicts possible interventions for reaching the target of carbon neutrality.
The mechanisms leading to trespassing tipping points are not yet fully understood and therefore they may be not reliably reproduced by climate models. This may cause climate simulations to underestimate the risk of extreme events.

Figure 8. Social tipping elements and associated social tipping interventions with the potential to drive rapid decarbonization in the World–Earth system. By Otto et al., 2020. CC BY 4.0, https://commons.wikimedia.org/w/index.php?curid=87320451.
5. Climate data
An essential element of scientific methods is the experiment, which is an empirical procedure to confirm of falsify competing theories or hypotheses. A classical methodological approach in environmental sciences is the so-called "natural experiment", that relies on observations of the variables of the system under study. In climate science this approach is applied by analysing historical data. A relevant limitation is that the observation period of observed data is limited. Ground observed temperature data with quasi-global coverage and good quality are available since 1850. Earlier records exist, but with sparser coverage and less standardized instrumentation. Even if temperature data are smoothly varying in time and space and does exhibit marked non-linearity, the above observation period is not extended enough to provide an exhaustive picture of long term variability.
The situation is even more uncertain for rainfall, which exhibits marked non-linearity in space and time. The longest continuous point rainfall records have been observed in Italy. The world's longest daily rainfall series is that of Padua, whose observation period goes back to 1713. The Padua series is discussed by Camuffo et al. (2020) and Marani and Zanetti (2014). The latter is an open access paper, I suggest looking at Figure 1 and 2 therein to get a visual idea of long term variability in climate. Another interesting example is the daily rainfall series collected in Bologna which dates back to 1813. Figure 9 outlines the annual cumulative rainfall values for such series and shows the multi-year droughts that occurred in the far past and represent a topical concern for modern society.

Figure 9. Annual rainfall in Bologna with multi-year droughts in grey.
The problem of the limited extension of the observation period is mitigated by the availability of proxi data. If observation of given variables are not available for the period of interest, one may look for observations of an auxiliary variable - the proxi variable - which is intimately related with the variable of interest and then used to infer its value. Examples of proxi data for temperature are ice cores, that may support reconstruction of past temperature through isotope measurements (see Figure 10), tree rings (Figure 11), fossil leaves, boreholes, corals, sediments and many others.

Figure 10. Isotope measurements, Antarctica ice core. By Q Science (talk) - I (Q Science (talk)) created this work entirely by myself using delta-Deuterium vs Depth and delta-O-18 vs depth data from government sites., CC BY-SA 3.0, https://en.wikipedia.org/w/index.php?curid=27509558.

Figure 11. Tree rings seen in a cross section of a trunk of a tree. By Arnoldius - Self-photographed, CC BY-SA 2.5, https://commons.wikimedia.org/w/index.php?curid=568944.
The uncertainty of proxi data is more pronounced with respect to the observed data and therefore the integration of two types of data may be not consistent.
A collection of proxi data that can be used to reconstruct past climate is presented by NOAA through an interactive platform. An interesting reference for Europe is the Old World Drought Atlas. By selecting in the menu "time series" the option extract, it is possible to download and visualise drought data for any location in Europe. When using such information, be sure of reading the disclaimers and get information on how the data were generated.
It is usual practice in climate science to use data simulated by models to infer the statistics of future climate and to compare the scenarios derived under different assumptions regarding model structure, future emissions, initial conditions and so forth. The use of models to test competing hypotheses is a usual practice in science. However, one should bear in mind that models are only an approximation of reality and are conditioned by the underlying assumptions. Therefore,to estimate the uncertainty of simulated data may be a difficult task. Moreover, one should be aware of the striking difference between the information content of observed versus simulated data. Climate models are not conceived for reproducing observed variables. They are conceived to provide future scenarios according to their underlying assumptions. Therefore, particular care should be taken when using model simulations to mimic the information content of observed data. In particular, care should be taken when using simulated data for technical design.
Figure 12 shows the projections of future temperature under low and high emission scenarios obtained with the Coupled Model Intercomparison Project 5.

Figure 12. CMIP5 average of climate model projections for 2081–2100 relative to 1986–2005, under low and high emission scenarios. By Efbrazil - Own work, CC BY-SA 4.0, https://commons.wikimedia.org/w/index.php?curid=87862027.
6. Climate impact
Assessment of climate impacts is an essential scientific step to derive information for technical design. Such assessment is generally carried out through data analysis or through a modelling cascade.
Data analysis relies on observed information on the magnitude of a given impact. For instance, Figure 13 and 14 report losses from weather disasters worldwide from 1980 to 2019 in terms of absolute values and percentage of global GDP. The graphs show that both losses and global GDP are progressing in time.

Figure 13. Losses from weather disasters worldwide 1980 - 2019 (inflation-adjusted, US$). Data from Munich RE (https://www.munichre.com/en/risks/extreme-weather.html#Explore%20our%20solutions).

Figure 14. Losses from weather disasters worldwide 1980 - 2019 as percentage of global GDP. Data from Munich RE (https://www.munichre.com/en/risks/extreme-weather.html#Explore%20our%20solutions) and World Bank (https://data.worldbank.org/indicator/NY.GDP.PCAP.CD).
Impact assessment from modelling cascade may again suffer from uncertainty, depending on the quality and resolution of input data and the non-linear superimposition of subsequent uncertainties. Also, one has to take into account that only few decision makers are trained to analyse the different outcomes of climate impact modelling. If modelling is integrated into conservation management it must be based on an evaluation of the need for information in protected areas and an assessment of model use in the management process, so as to guarantee maximum usability.
References
Papalexiou, S. M., AghaKouchak, A., Trenberth, K. E., & Foufoula‐Georgiou, E. (2018). Global, regional, and megacity trends in the highest temperature of the year: Diagnostics and evidence for accelerating trends. Earth's future, 6(1), 71-79.
Timothy M. Lenton et al. (2008): Tipping elements in the Earth's climate system. In: Proceedings of the National Academy of the Sciences. February 2008, doi:10.1073/pnas.0705414105
Otto, I. M., Donges, J. F., Cremades, R., Bhowmik, A., Hewitt, R. J., Lucht, W., ... & Schellnhuber, H. J. (2020). Social tipping dynamics for stabilizing Earth’s climate by 2050. Proceedings of the National Academy of Sciences, 117(5), 2354-2365.
Download the powerpoint presentation of this lecture.
Last modified on Oct 31st, 2023
- 2731 viste