
Monitoring of waves allows the collection of data to support understanding wave behaviours and estimating design variables for coastal and off-shore infrastructures. Wave monitoring started relatively recently, during the second world war when armies needed to predict sea conditions in enemy beaches. Later on, incentive to measure wave height and periods arose from research purposes related to civil engineering design. In recent times, the expansion of off-shore resources exploitation stimulated the desire to gain a deeper understanding of waves, not only related to their extreme values but rather extended to the whole wave regime.
When measurements became available the complexity of sea waves emerged in its fascinating reality. It was immediately clear that the shape of the sea surface is the results of the superimposition of several causes and resulting waves, and therefore the integration of several different sensors was needed. After data collection started it was clear that observations deliver essential information to relate the weather conditions, and in particular wind direction and speed, to wave behaviours. Data are particularly important in the proximity of the shoreline, where the relationship between winds and waves is also impacted by the local geometry of the sea bottom, that gets closer and closer to the sea surface, and the possible presence of infrastructures. While in open ocean the link between winds and waves is more direct, in the proximity of the shoreline it becomes more complex and therefore data are needed in order to relate the stochastic behaviours of waves to weather conditions.
Unfortunately, coastal engineers need to struggle with limited availability of data, as it often happens in hydrology and water engineering in general. In many cases meteorological records are not available as well and therefore the behaviours of waves must be inferred by collecting ad-hoc observations during the limited time step of the design period. While wave theory provides physically-based support to inference, the stochastic nature of waves generation and movement makes data necessary to decipher the random features of dominating waves. Furthermore, one should take into account that wave measurements are not easily transferable from one site to another, as wave propagation depends on local sea behaviours.
Recorders may be classified in three main groups:
- Recorders measuring below the sea surface
- Recorders measuring at the sea surface
- Recorders measuring above the sea surface
Waves can be recorded by pressure sensors located below the sea surface. They are therefore hidden and protected against interferences, deliberated or not, that may occur at the surface. Most of the sensors are transducers providing an electric signal that is converted into a time-dependent record of surface water level. Being always submerged, the instrument is also protected against wet-dry cycles, but the signal is impacted by attenuation due to water. The incidence of the error increases for increasing water depth and decreasing wave period. The first instruments were connected with a cable to transmit the recordings, while recent devices adopt wireless solutions with automatic transmission.
Another type of recorder is the inverted echo sounder, that emits a narrow bean pulsed signal from the sea bottom and detects the echo from the surface. The advantage is that this type of instrument does not suffer from attenuation.
Instruments recording at the sea surface include staffs (see Figure 1) and sensors installed in buoys and ships. Staffs are vertical measuring devices that are emerging from the sea surface and are equipped with a length scale allowing a visual assessment of sea level. In ancient times the measurements were manually taken by personnel watching at the length scale at prefixed times, while modern instruments are equipped with electrical wires transmitting a signal that is subsequently converted to sea level. Measurements are high resolution and accurate, but in extreme conditions uncertainty may arise due to splashing and wire wetting by spray. Calibration is required to increase accuracy in different sea conditions. More details on staffs can be found in this page.
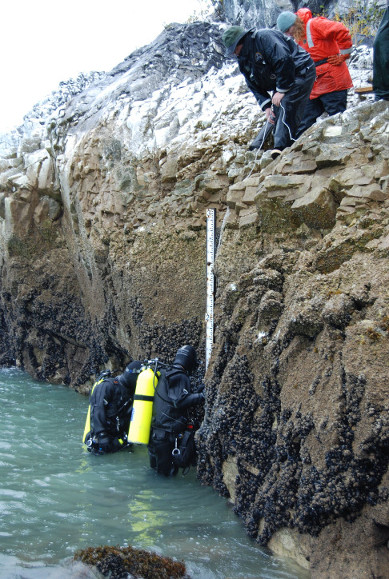
Figure 1. Example of a tide staff. By Ensign Patricia Raymond, NOAA Corps. - NOAA Photo Library: cgs01242, Public Domain, https://commons.wikimedia.org/w/index.php?curid=17969322
The most frequently used instrument for sea wave recording is the waverider buoy (see Figure 2). The instrument floates in the sea and measures its own vertical motion. An accelerometer detects the signal that is converted to wave height and period. Modern instruments may also allow to infer wave direction through multiple measurements along the buoy contour. Buoys present the advantage that they can be located at a high distance from the shoreline (up to tens of kilometers). Furthermore, their accuracy and reliability is very high. However, they are vulnerable to inference by humans and animals (see Figure 2 for an example), the radio signal may become unreliable for high distances, they are vulnerable to currents that may introduce uncertainty, and they are less efficient in measuring long period waves. Finally, they are expensive instruments. Further details on how wave data are derived from buoy motion measurements are given at this NOAA page. Data available for download can be found, for instance, here and here.
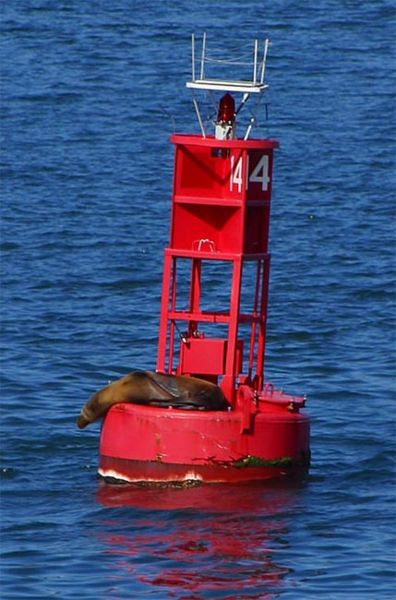
Figure 2. Example of waverider buoy. By User:RadicalBender (Special:Contributions/User:RadicalBender) [Public domain], via Wikimedia Commons.
Another solution is the shipborne wave recorder, that has been widely used in the past. Pressure from pickups either sides of the vessel is combined electronically with the vertical oscillation and acceleration of the ship. These instruments are usually less efficient with small period waves. These instruments are expensive.
The instruments placed above the sea surface are increasingly used and convey interesting perspectives for the future. They include instruments carried by aircraft and satellites, as well as instruments fixed to structures above the sea surface. Cameras and videocameras have been used for this purpose since the second half of the past century. Movies or lapse photos of the water level against a pole emerging from the surface have been frequently used. They require consistent man power to analyse the pictures, but turned out to be very useful to understand the stochastic behaviours of waves during extreme events, especially when other measuring tools may become inefficient or highly uncertain. Photographs of floating buoys have also been used by several monitoring stations. Furthermore, stereo-photographs of the sea surface from a plane have been used in some cases, which also allow to infer the wave direction.
Very interesting perspectives are conveyed by wave radars. These are indicated when one needs to avoid direct contact with the water surface and structural interference. Radars are frequently used in offshore platforms in the presence of high currents making the use of buoys difficult. The echo signal detected by the radar is converted in an electrical signal and then in surface water level. The potential limitation is given by the difficulty to detect the position of the sea surface when the it is aerated and/or spray is present. This situation may occur during extreme events. Additional disturbances may be given by interferences with the supporting structure.
Measurements taken by satellites are also increasingly used to infer ocean surface topography. Ocean waves have been first measured by satellites by NASA's Skylab space station in 1973. However, only in recent time access to consolidated datasets on ocean waves for scientists and engineers has been made available. An example of a satellite mission dedicated to ocean monitoring is provided here. Figure 3 shows a map of the ocean dynamic topography of Oct 3, 1992. Measurements from satellites may be not efficient for short wave periods.
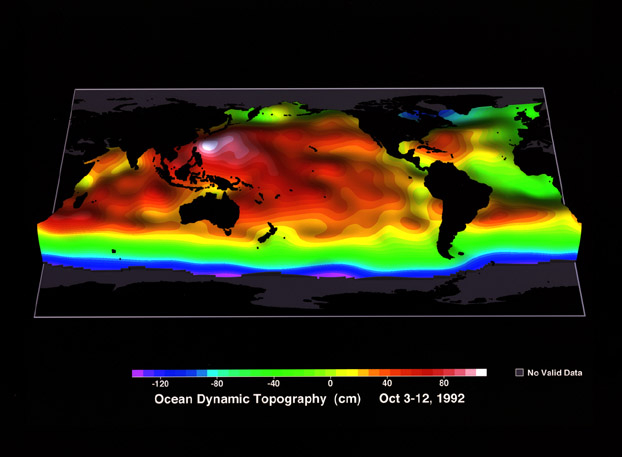
Figure 3. Ocean dynamic topography surveyed on Oct 3, 1992. By NASA/JPL - http://sealevel.jpl.nasa.gov/gallery/science.html, Public Domain, https://commons.wikimedia.org/w/index.php?curid=4842354.
A visualization of wave data taken by satellites is given by this Science Graphic of the Week. More information is given in this video.
There are several wave monitoring programs that make information available on the web. An example is given by the Queensland Govenment. Information is provided here and here.
ISPRA is the Italian National Institute for Environmental Protection and Research. It is part of a network known as National System for Environmental Protection, which is made up of 21 Territorial Environmental Protection Agencies, established by Regional Laws. It's an example of consolidated federal system, which combines the direct knowledge of the land and its issues with the national policies for environmental protection. ISPRA manages the Atlas of the Coasts, to carry out a preliminary investigation of the meteo-marine characteristics of the Italian seas. One of the purposes is to monitor and analyse coastal erosion.
Starting from 1989 ISPRA launched the Italian Wind Wave Network (RON). Waves are monitored through buoys displaced along the Italian coast (see Figure 4 and Figure 5). Main wave parameters were recorded every 30 minutes from 2002.
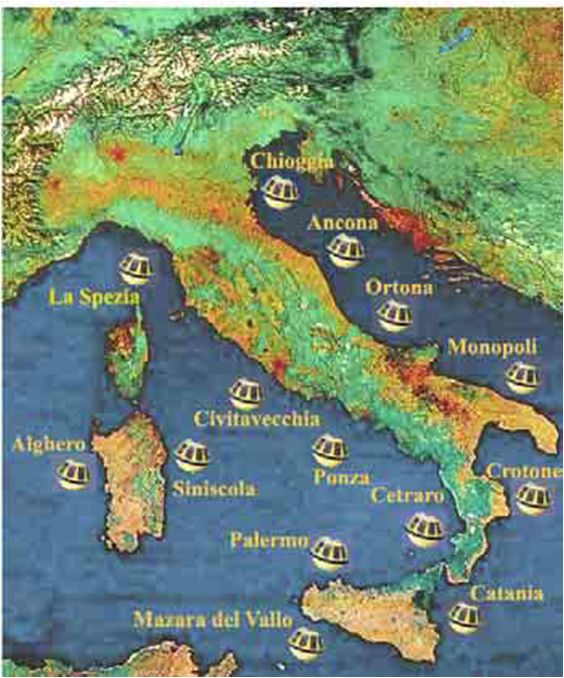
Figure 4. Location of the buoys of the Italian Wind Wave Network (RON). Courtesy by Arianna Orasi (ISPRA)
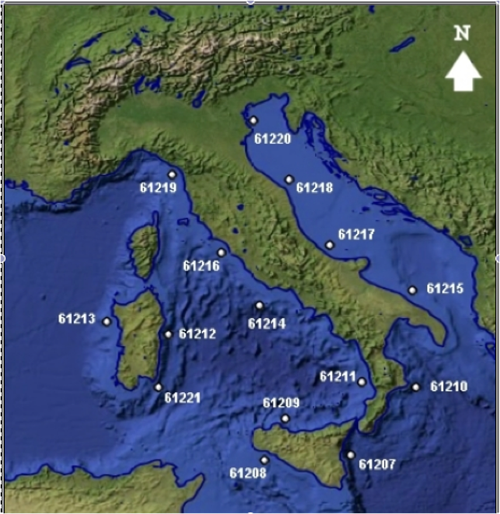
Figure 5. Location of the buoys of the Italian Wind Wave Network (RON). Courtesy by Arianna Orasi (ISPRA)
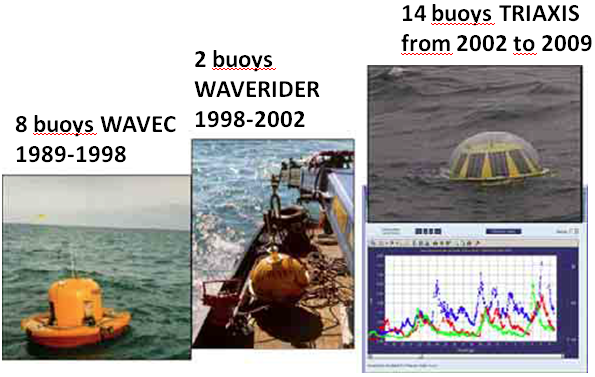
Figure 6. Buoys of the Italian Wind Wave Network (RON). Courtesy by Arianna Orasi (ISPRA)
The following wave parameters are measured every 20 min:
- Date: UTC dd/mm/yyyy HH.MM.SS
- Hm0: Significant wave height (m)
- Tp: Peak Period (s)
- Tm: Mean Period (s)
- Dmt: Mean wave direction (deg N)
- Dmp: Peak mean total direction (deg N)
- Dmw: Mean windwaves direction (deg N)
- Tmp: Water Temperature (deg C)
while the following meteorological data are observed:
- Date: UTC dd/mm/yyyy HH.MM.SS
- WS: Wind speed (m/s) Ultrasonic 2-D GILL WINDSONIC at 2.7 m height
- WG: Wind gust (m/s)
- WD: Wind direction (deg N)
- Ta: Air temperature (deg C)
- Dpt: Dew point (deg C)
- RH: Relative Humidity
- BAR: Atmospheric pressure (hPa)
On the basis of the observations, wave climate is assessed. Wave climate indicates the statistical characteristics of wave parameters recorded for a number of years and analysed on a yearly, monthly or seasonal basis. Examples are the joint frequency of occurrence of wave height /direction and the persistence of significant wave height above assigned thresholds. An example is given by Figure 7.
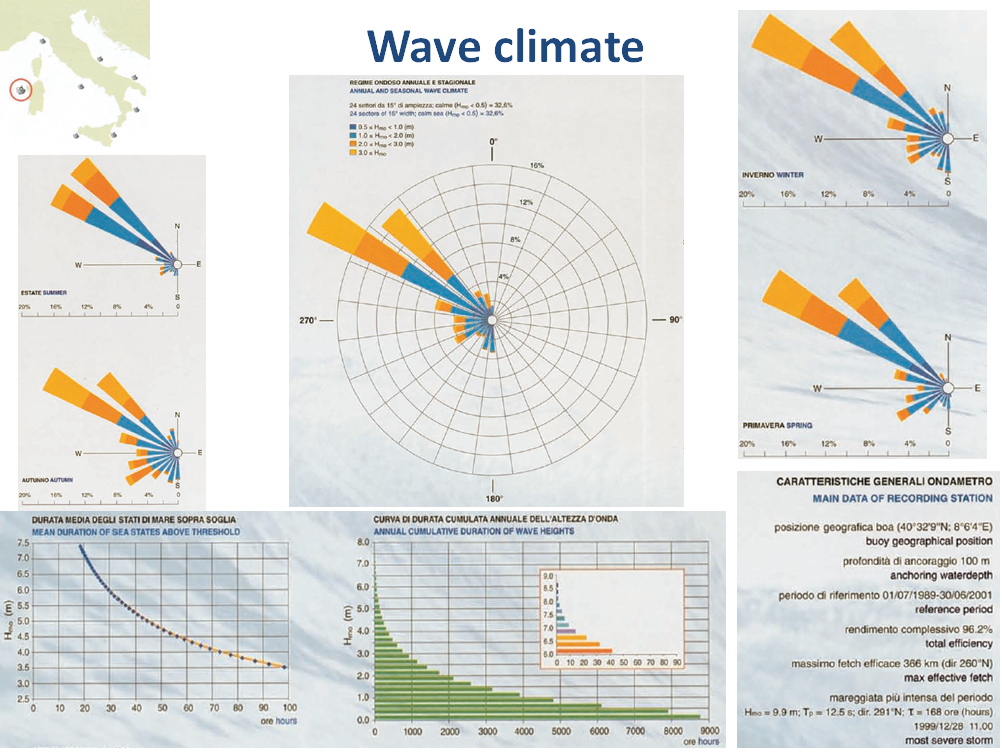 Figure 7. Wave climate for a buoy located along the coast of Sardinia. Courtesy by Arianna Orasi (ISPRA)
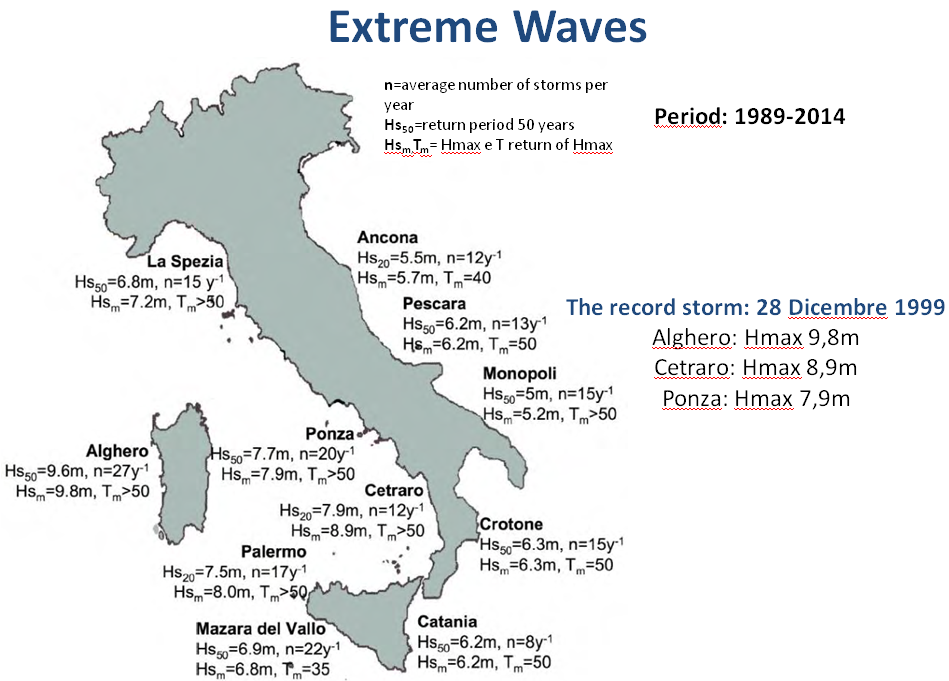 Figure 8. Wave climate for buoys located along the coast of Italy. Courtesy by Arianna Orasi (ISPRA)
ISPRA also runs forecasting models for sea state, producing hourly prediction with lead time up to several days. Details can be found on the ISPRA web site.
Recently, the Italian National Centre for Coastal Defence (CN COS) of the Institute for Environmental Protection and Research (ISPRA) has been carrying out environmental monitoring and characterization of the coast and coastal dynamics at national level. of the Italian Military Geographical Institute (IGM). This activity allowed to develop a Geodatabase containing the linear information on the characterization of the natural and artificial elements shaping the coast lLine and the backshore line as well as the areal elements representing the beaches, derived from photointerpretation of aerial and satellite images (Bonora et al., 2022). The database is projected to be periodically updated, thus allowing a spatial-temporal analysis of the evolution of the coastline, accretion and erosion processes. In particular, the layers provide:
- 'historical' coastline derived from the digitalisation of 1:25 000 maps dating back to the 1950s;
- the 2000 and 2006 coastlines obtained from orthophotos with ground resolution values of 1 and 0.5 m;
- the 2020 coastline, based on Google Maps images, with resolution lower than 1 m.
The database is available here. In its present version is in Italian only.
The information contained in the database allows to visualise the evolution of the coast line along the years. For example, D'Ascola et al. (2005) present an application to the coast of Castiglione della Pescaia, in Italy. The metadata also provide information on the state of the beach, their evolution and their vulnerability to erosion.
An extended description of monitoring techniques, with technical details is provided by Driver (1980), A guide to sea wave recording, Report n. 103, Institute of Oceanographich Sciences, United Kingdom, unpublished manuscript. The document can be downloaded here.
Bonora, L., Carboni, D., De Vincenzi, M., Matteucci, G. (2022) Ninth International Symposium “Monitoring of Mediterranean Coastal Areas: Problems and Measurement Techniques”, available here.
D'Ascola, F., Cassese, M.L., Lugeri, N., Pesarino, V., Salmeri, A. (2005), The ISPRA geodatabase for monitoring and analysis of the state of the italian coasts: an example of its application to the Rocchette - Castiglione della Pescaia coast line, in Ninth International Symposium “Monitoring of Mediterranean Coastal Areas: Problems and Measurement Techniques”, edited by Bonora et al.
Last updated: April 5, 2023
- 588 views