

The importance of water for life and therefore human society is well known. The distribution of water in space and time is extremely important to secure water to human population. Even more important for human use are water fluxes among the water volumes stored in the earth's crust and the atmosphere. Although much of water is continuously moving, one could ideally take an instantaneous picture of water distribution in the earth system therefore obtaining the following rough numbers. Water covers about 71% of the Earth's surface. About 96.5% of the planet's crust water is found in seas and oceans, about 1.7% in groundwater, about 1.7% in glaciers and the ice caps of Antarctica and Greenland. A small fraction of water is contained in other large water bodies, and about 0.001% in the air as vapor, clouds (formed of ice and liquid water suspended in air), and precipitation. About 2.5% of water is freshwater, and 98.8% of that water is in ice (excepting ice in clouds) and groundwater. Less than 0.3% of all freshwater is in rivers, lakes, and the atmosphere, and an even smaller amount of the Earth's freshwater (0.003%) is contained within biological bodies and manufactured products. A greater quantity of water is found in the earth's interior. More information on water distribution is given here and in Figure 1.
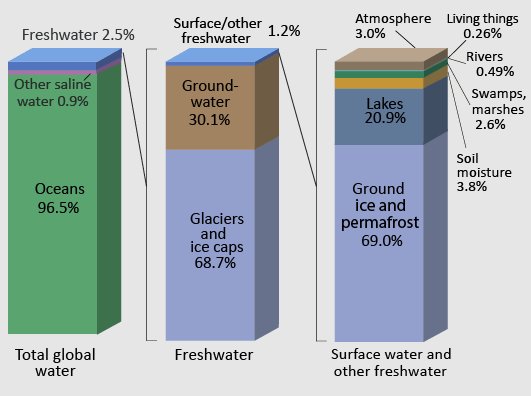
Figure 1. Sketch of water distribution on Earth. By NASA Official website, [1]., Public Domain, https://commons.wikimedia.org/w/index.php?curid=49654959
Growing pressure on water resources – from increasing population and societal well being, climate change, and other forcings – has major impacts on sustainable development. In fact, economic growth requires water availability. Water is a vital factor of production, so diminishing water supplies can translate into slower growth that cloud economic prospects. Furthermore, lack of enough water can induce migration and ignite civil conflict. Food price spikes caused by droughts can inflame latent conflicts and drive migration. Although there is enough water in the earth system to well sustain life and human population, its uneven distribution in space and time induces water scarcity and associated poverty and social tensions in large areas of the world (see a recent newspaper article here). Groundwater resources are overexploited in several areas of the world. Major rivers – including the Colorado River in the western United States and the Yellow River in China – no longer reach the sea in most years. Some 780 million people around the globe still lack access to clean water and thousands perish daily for lack of it.
The world’s water problems stem from our failure to meet basic human needs, ineffective or inappropriate institutions and management, and our inability to balance human needs with the needs of the natural world. However, the above mentioned volumes of water would be enough to feed future humanity even in the presence of demographic expansion and therefore solutions to the water problem do exist. It is therefore compelling to identify solutions to ensure the sustainable development of an increasing population.
Hitherto it was mentioned that the water problem is originated by the uneven distribution of freshwater in space and time. The distribution of water resources is strictly related to the distribution of precipitation, that provides the input to the water cycle. Global distribution of rainfall can be efficiently measured through satellite observations. This video by NASA's Goddard Space Flight Center shows through an animation the global precipitation from April to September 2014. Figure 2 shows a global map of mean monthly rainfall.
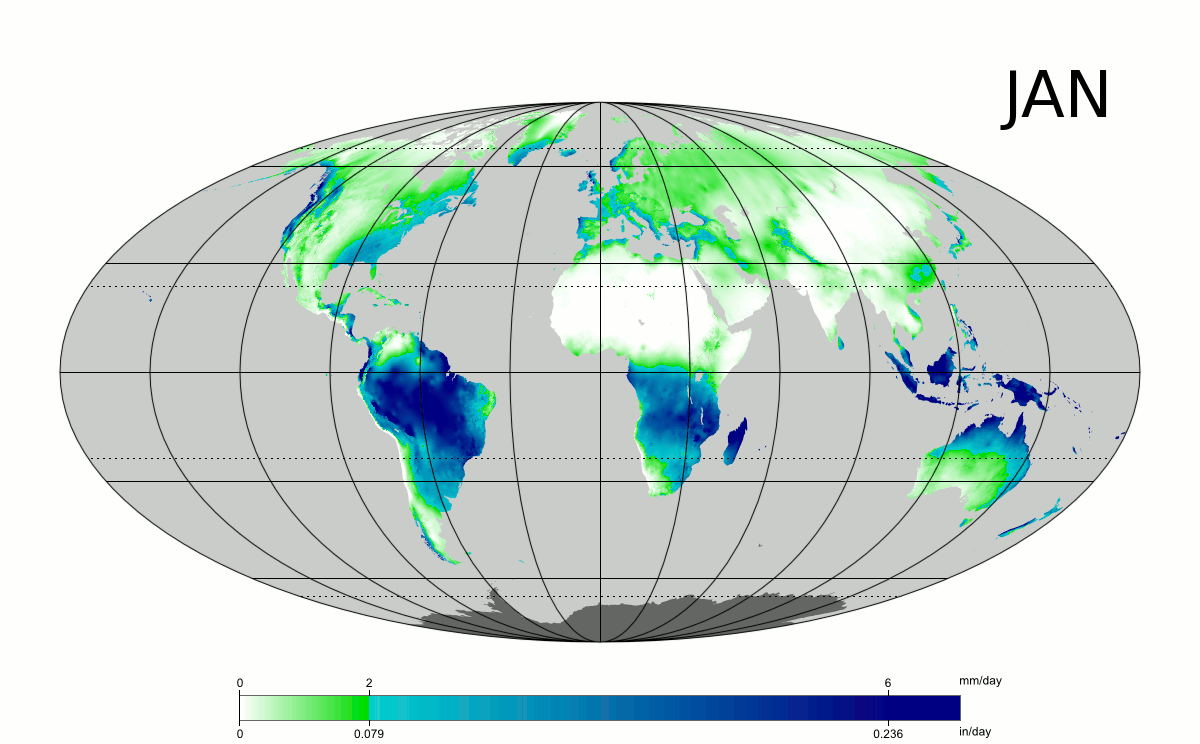
Figure 2. Global distribution of mean monthly rainfall. By PZmaps - Own work by uploader, sources: CRU CL 2.0 (New, M., Lister, D., Hulme, M. and Makin, I., 2002: A high-resolution data set of surface climate over global land areas. Climate Research 21: 1–25) and File:Tissot indicatrix world map Mollweide proj.svg by Eric Gaba., CC BY-SA 3.0, https://commons.wikimedia.org/w/index.php?curid=6043378
Water resources availability is also heavily influenced by evapotranspiration. A synthesis of the interplay between precipitation and evapotranspiration is given by the Köppen climate classification, that is, a climate classification system
The Köppen classification is based on average monthly values of temperature and precipitation. Five primary types of climate are identified, labeled from A through E. Primary types are A, tropical; B, dry; C, mild mid-latitude; D, cold mid-latitude; and E, polar. Secondary classifications for A are f (rainforest), m (monsoon), w (savanna, wet), s (savanna, dry); for B, they are: W (desert), S (steppe); for C we have s (dry summer), w (dry winter), f (without dry season); for D: s (dry summer), w (dry winter), f (without dry season); finally, for E: T (tundra), F (eternal winter). Figure 3 shows a global map.
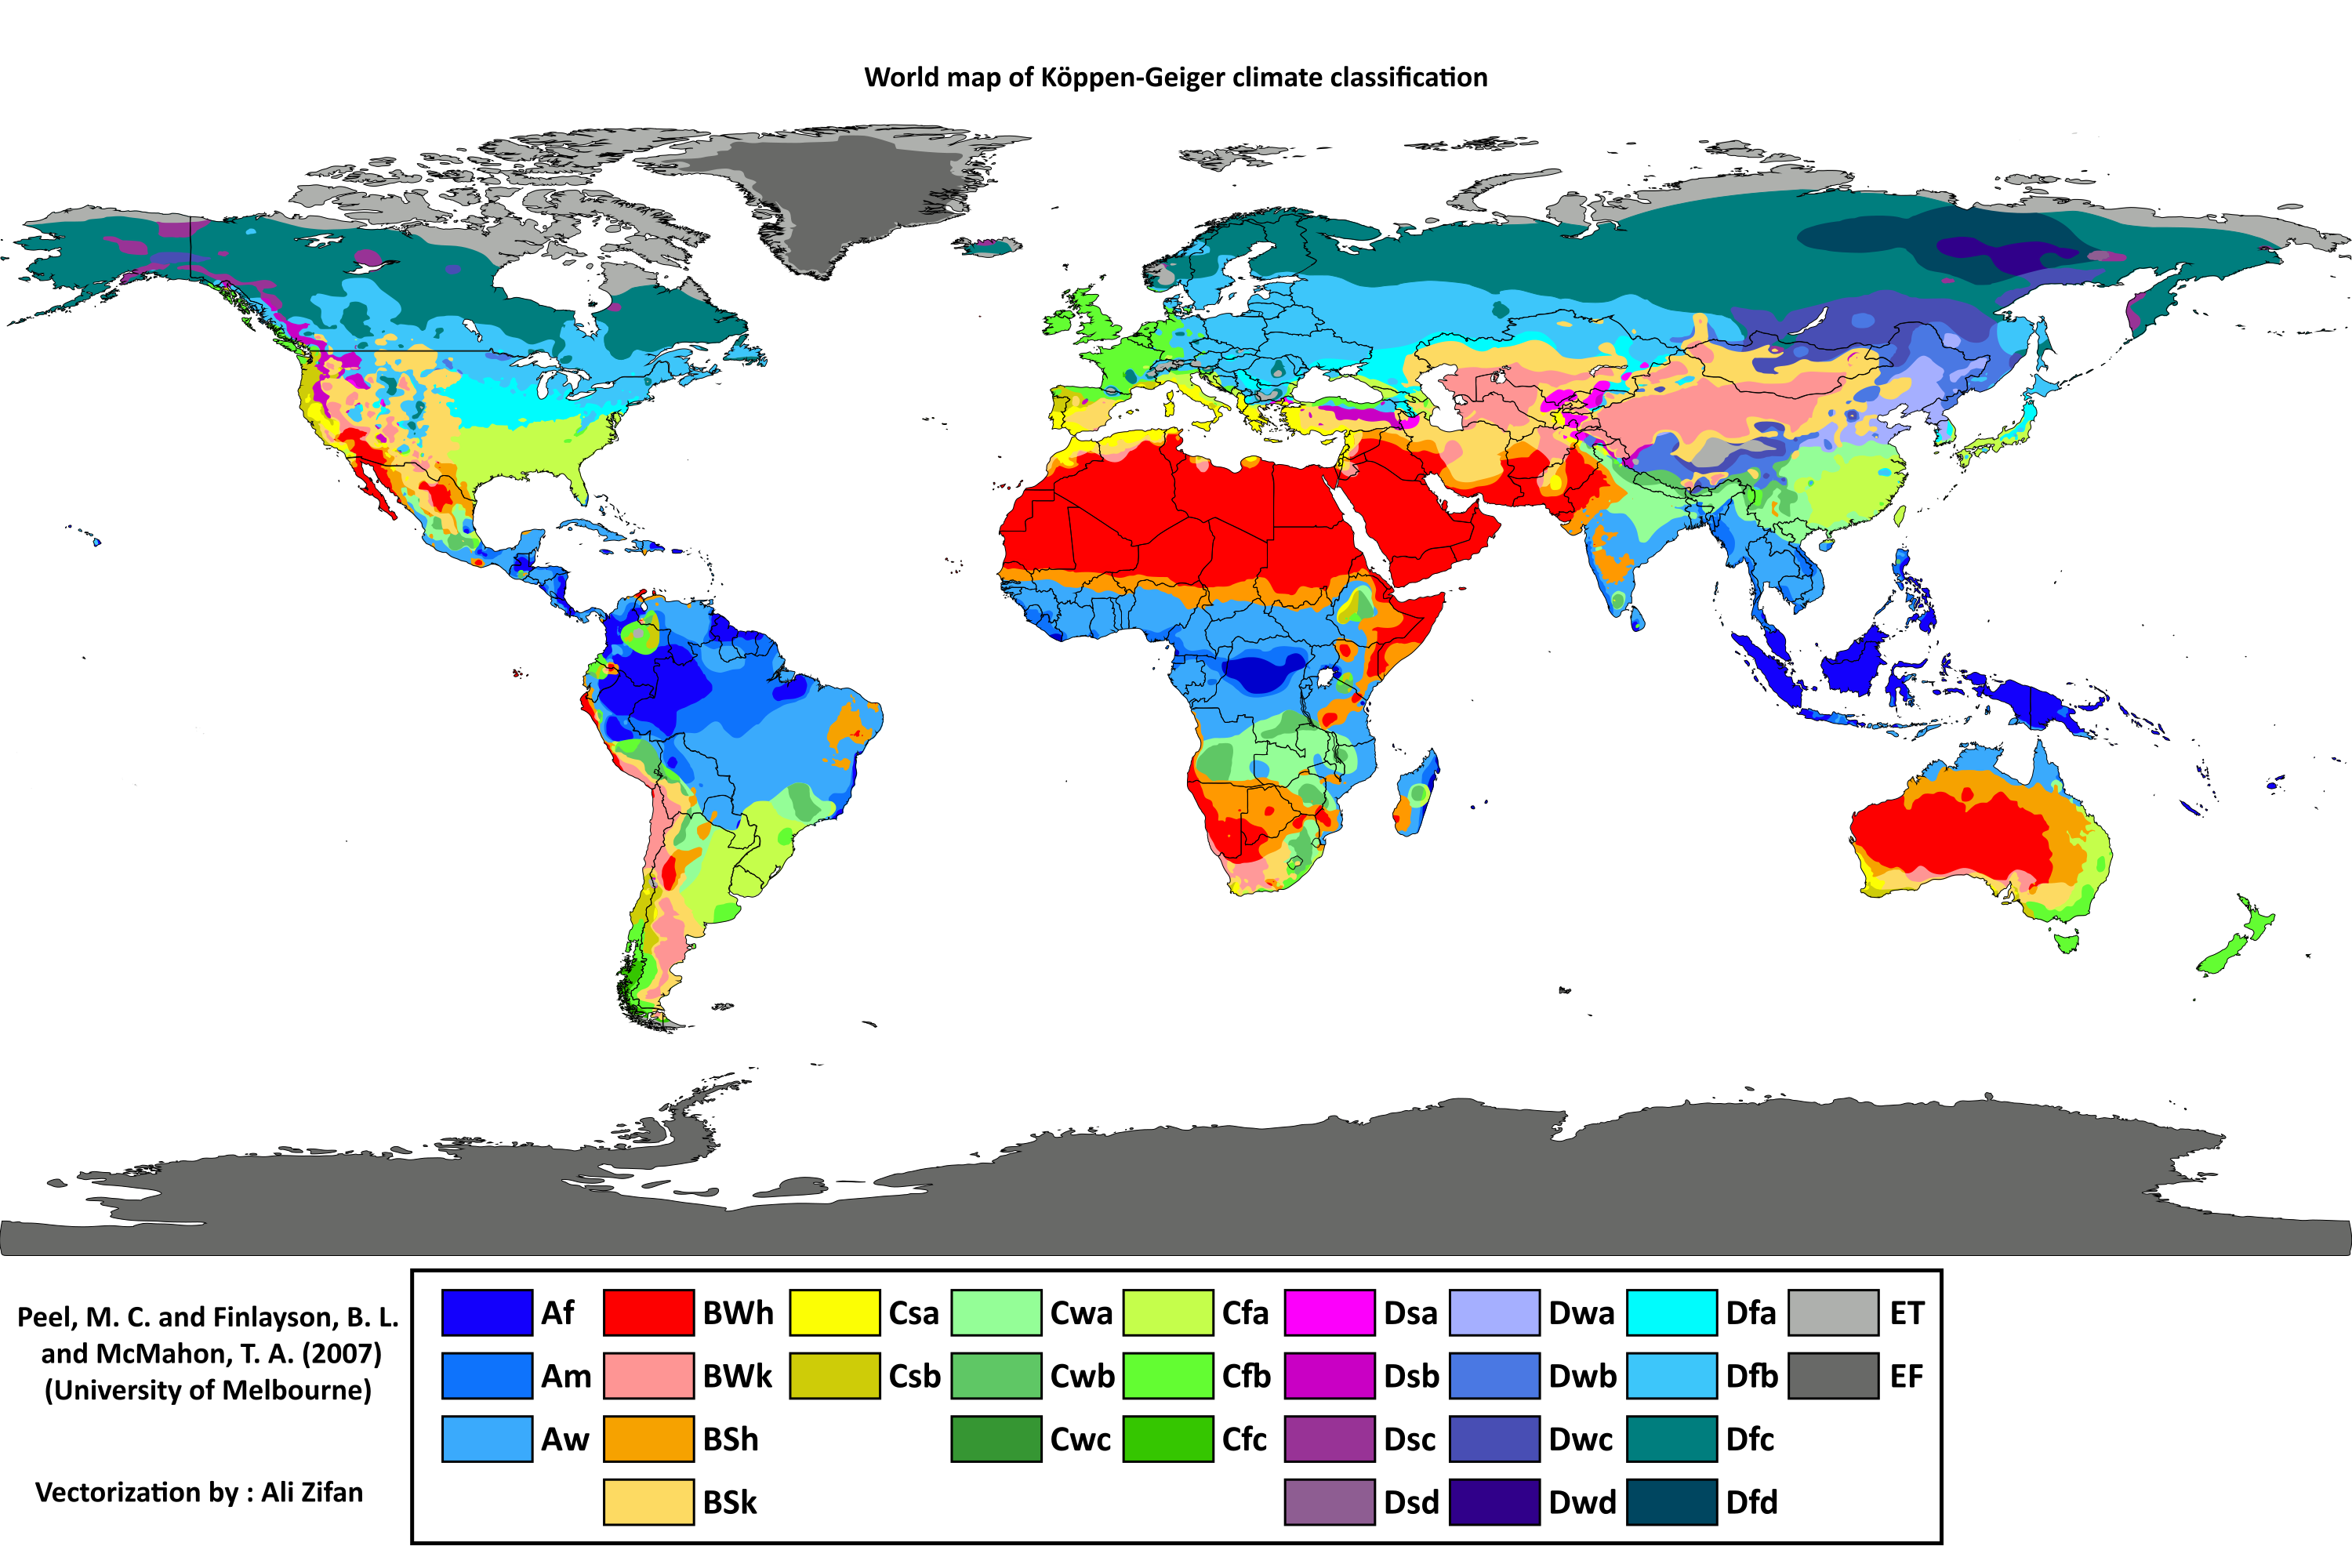
Figure 3. Köppen climate classification. By Peel, M. C., Finlayson, B. L., and McMahon, T. A.(University of Melbourne)Enhanced, modified, and vectorized by Ali Zifan. - Hydrology and Earth System Sciences: "Updated world map of the Köppen-Geiger climate classification" (Supplement)[1]Legend explanation, CC BY-SA 4.0, https://commons.wikimedia.org/w/index.php?curid=47086879
A comprehensive picture of water availability and distribution is provided by the Aquastat FAO Database. Figure 4 shows a global map of the amount of total renewable water resources per inhabitant in 2014. The same picture, updated at current time through a dynamic link to the database, can be seen here. The distribution of water resources is mainly conditioned by the distribution of rainfall.
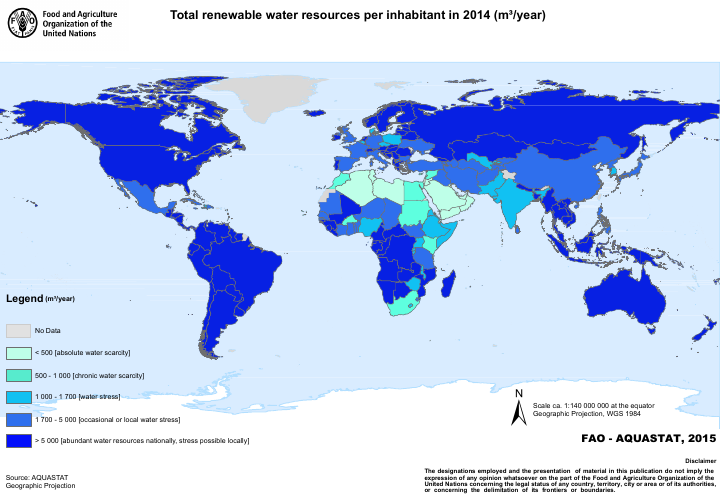
Figure 4. Global distribution of total renewable water resources per inhabitant.
Figure 5 and 6 show the global distribution of the proportion of renewable water resources that is withdrawn (an updated version is available on the Aquastat web page) and water withdrawn per inhabitant. The figures show that water withdrawal is related to societal development. Figure 7 shows the global distribution of proportion of total water withdrawal that is withdrawn for agriculture. The latter figure shows that water for food is a relevant proportion of freshwater consumption.
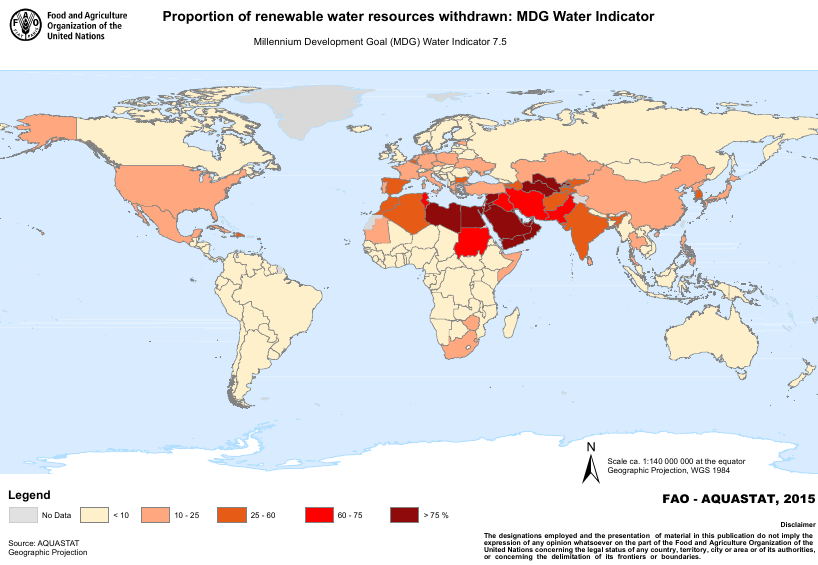
Figure 5. Global distribution of the proportion of renewable water resources that is withdrawn.
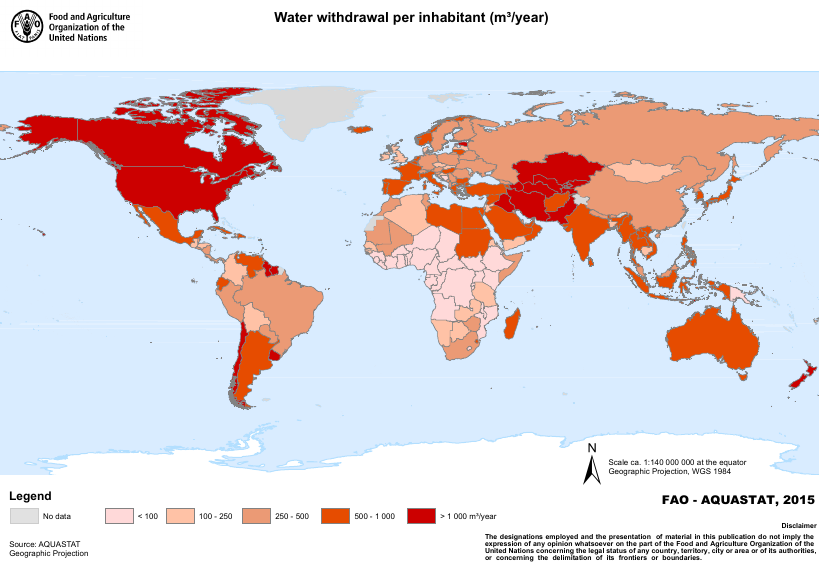
Figure 6. Global distribution of water withdrawn per inhabitant.
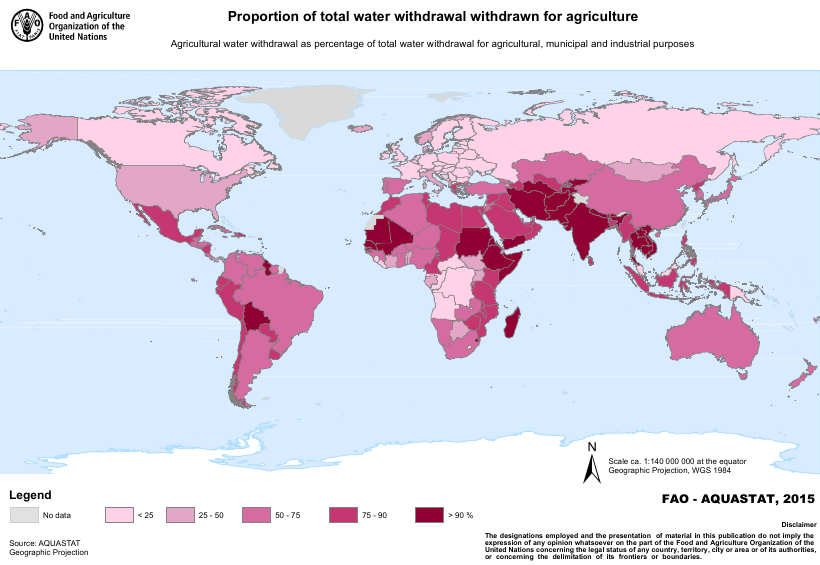
Figure 7. Global distribution of proportion of total water withdrawal that is withdrawn for agriculture.
The above figures show that the spatial distribution of water resources is indeed affected by significant variability. While there is in principle enough freshwater to satisfy human needs, humanity faces the challenge that water is not evenly spatially and temporally distributed, and water is difficult to transfer both in space and time. In terms of time distribution, one may note that it is mainly caused by seasonality, which affects surface water more than groundwater, that has a slower response to precipitation input. Time variability is dictated by climatic behaviours. Seasonality in surface water resources is therefore extremely important for water resources management, This is the reason why it is often quantified, through a picture of mean monthly river flow, when describing a catchment for its implications in water management (see Figure 8).
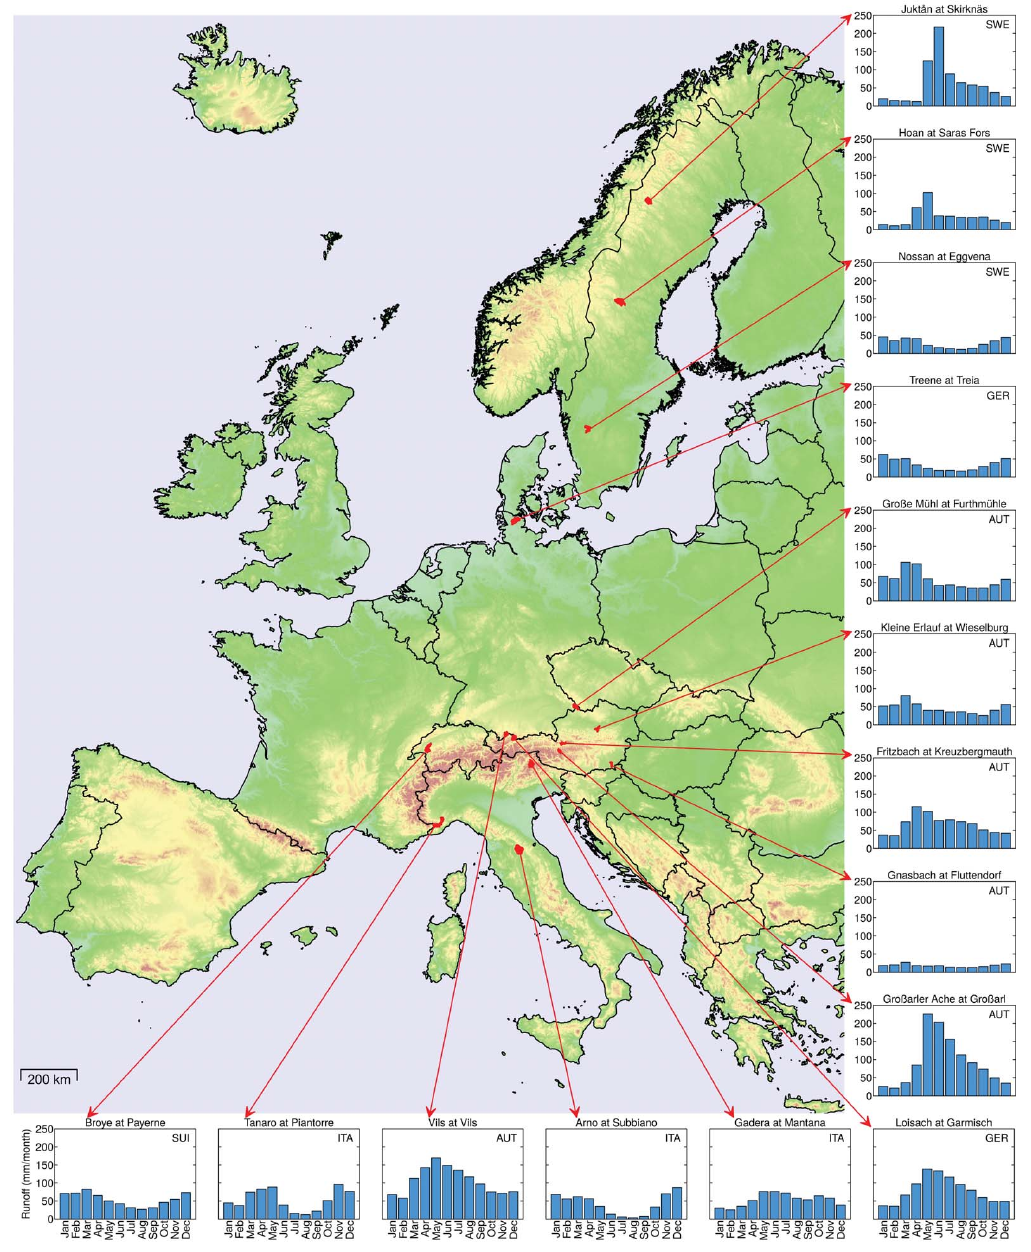
Figure 8. An example of space-time variability of river flows for selected European catchments. River flow seasonality is expressed in mm/month.
Time variability is traditionally compensated by water storage, while spatial variability may be compensated through water transfer, which is nevertheless complicated when relevant volumes come into play, like for instance when transferring water for irrigation.
The emerging global picture is that nearly a quarter of humanity already reside in water-scarce countries and water scarcity may proliferate to more regions. These hydrological changes may have significant impacts on agricultural productivity as well as on cities where people and economic activity are concentrated. The primary message of the water-climate nexus is that trade-offs between water requirements for food and energy production, the environment, and urbanization are significant, and will require careful assessment by policymakers.
Dealing with variability in space and time of water resources has traditionally been one of the more challenging human endeavors. In recent time the complexity of the problem increased for the augmented water demands and the impact of climate change. In general, solutions to water scarcity can be classified into three main categories: (a) solutions aimed at increasing the supply of water; (b) solutions designed to decrease the demand of water; and (c) solutions aimed to reduce risks from water extremes.
Historically, the solution to increasing water scarcity was to increase the supply. The Ancient Romans, for instance, used enormous networks of aqueducts to move water hundreds of miles from areas of abundance, usually high up in the mountains, to their cities. The Ismailia Canal, built along the Suez Canal, was constructed in 1863 to bring freshwater from Lake Timsah to the city of Suez. Where compensation of time variability was needed, reservoirs were built to accumulate water when abundant to make it available for the dry season. When the demand for energy increased, these reservoirs were also used to generate hydropower. In some countries they are used to mitigate flood risk, so that a multiple use of reservoirs became widespread.
In Europe and United States reservoirs were extensively built during the past century. Today, reservoirs of large size are being built in regions were past societal and environmental conditions discouraged the use of reservoirs. The list of the largest dams in the world is available here.
The reservoir size that is needed to fully compensate water distribution in time increases with increasing time variability of river flows. It also increases for increasing memory of the river flows. The optimal size of a reservoir can be estimated by applying the mass diagram analysis, which is also called Rippl method.
Today, however, the most interesting locations for reservoirs have already been considered. Thus, even though we only utilize a small fraction of the available freshwater on the planet, areas of abundance tend to be very far from, or inaccessible to, regions of scarcity. Moreover, the advent of the green politics discourages the use of reservoirs for resolving water scarcity problems.
Nevertheless, advancing technologies do offer opportunities for water supply expansion, and water resource recovery, in some regions. One such opportunity, particularly for large cities, is wastewater recycling. Indeed, the principles of circular economy suggest the opportunity to consider the option of circular water resources management, which means that water should be recycled after any use. According to these concepts, the idea of autonomous buildings was recently proposed. These buildings are equipped for recycling waste water and for harvesting water from rainfall.
Wastewater recycling plants typically have two major drawbacks: they tend to be extremely energy intensive and they also generate a byproduct, known as sludge, which is difficult to dispose of in an environmentally safe way. Recent technologies, however, show promise for greatly alleviating these problems, making wastewater recycling a much more viable prospect for addressing water scarcity in cities.
Another means of increasing the water supply is desalination. Desalination has the potential to create a virtually limitless source of drought-proof, clean water in coastal areas. Desalination is currently not convenient in many countries. While there are significant variations, desalination typically requires up to 23 times as much energy as water withdrawn from surface sources such as lakes and streams and this translates into higher costs. On average desalinized water costs about 4 to 5 times more than treated surface water (see Figure 9).
However, the cost of desalination, both in financial terms and in energy requirements, has fallen dramatically in the past decade, and as renewable energy technology advances, these costs may continue to fall (World Bank, 2016). Desalination may have an interesting potential, but there is the need to address the economic and ecological impacts of brine, the byproduct of desalination, and the impact of water intake on fisheries and aquatic environment.
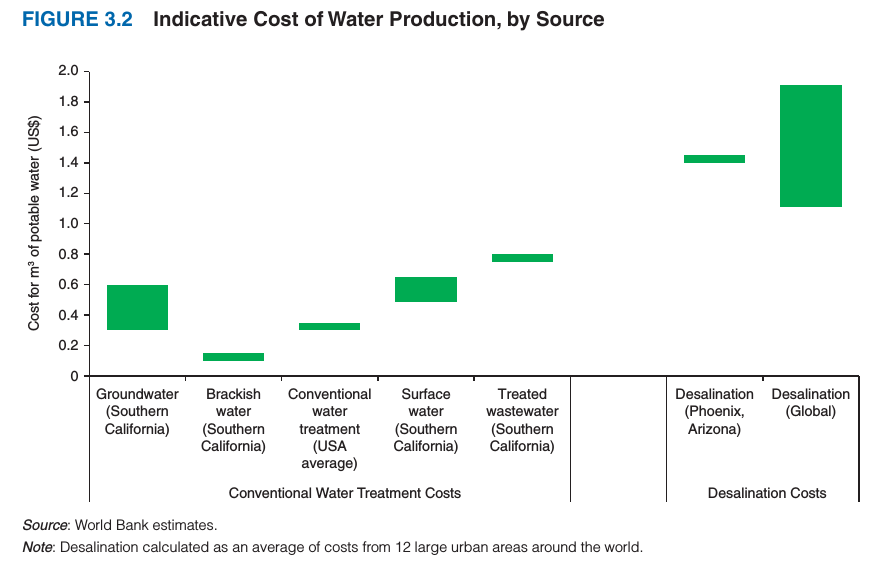
Figure 9. Cost of water withdrawn from several alternative sources.
The down side of securing more water is the increase in water demands. An example is the Emilia-Romagna region, in Italy, where increased water availability encouraged farmers to opt for water demanding crops, which turned out to be more convenient in terms of revenue. Increased water availability for agriculture was the cause of the Lake Aral disaster.
Therefore, the increase of water supply should be also integrated with strategies for controlling and regulating the demand.
Water demand is a fundamental driver of water balance and water scarcity. Improving water resources management requires a better understanding of water demands, water losses and techniques for improving the efficiency of water allocation. Water losses are still significantly impacting water resources systems, therefore originating the non-revenue water flow. Non revenue water is water that has been produced and is lost before it reaches the customer.
In irrigation, water losses are about the same order of magnitude of water delivered at the field. In water distribution systems for civil use water losses are about 50% of water allocation. Reducing water losses is a compelling requirement for modern water distribution systems. Losses in water utility operations occur in two distinctly different manners. Apparent losses occur due to customer meter inaccuracies, billing system data errors and unauthorized consumption. These losses cost utilities revenue and distort data on customer consumption patterns. Losses also occur as real losses or water that escapes the water distribution system, including leakage and storage overflows. These losses inflate the water utility’s production costs and stress water resources since they represent water that is extracted and treated, yet never reaches beneficial use. Identification and estimation of water losses is a very active research field.
Pricing is another instrument that could be used to reduce water demand. For municipal use, water pricing tends to be the simplest and most effective tool for moderating water use. Households are connected to a utility which can keep track of water use via a meter. High water prices tend to be effective at reducing municipal demand, and targeted subsidies or block tariffs can be strategically employed to ensure that the most vulnerable retain access to water and are not priced out of the market. When utilities are required to recover costs, they have a greater incentive to prevent revenue losses by fixing leaks in the system.
Nevertheless, municipal water use is only a small fraction of total water use. Significantly more water is used for commercial purposes, particularly irrigated agriculture, where pricing is more complex. Water use for these purposes tends to be more inelastic than municipal water, making pricing less effective in reducing demand. Further, agricultural water use is much more difficult to track than municipal water, particularly when farmers can drill into an aquifer and access groundwater, thus circumventing the higher prices.
Water price reforms can also go a long way towards incentivizing the creation and adoption of water saving technologies. Finally, there are also opportunities to alter behavior and change thirsty consumption patterns through education, and using social norms to signal consent or disapproval. How people act and think often depends on what others around them do and think. The tools based on these behavioral nudges do not displace existing policy approaches that target incentives; rather, they complement and enhance them. There is limited use of these approaches in the sector and many of the emerging policy implications require further study (World Bank, 2016).
An interesting option to reduce water demands is virtual water transfer. Virtual water trade (also known as trade in embedded or embodied water) refers to the hidden flow of water if food or other commodities are traded from one place to another. For instance, it takes 1,600 cubic meters of water on average to produce one metric tonne of wheat. The precise volume can be more or less depending on climatic conditions and agricultural practice. Therefore, if food and other commodities are traded, then the effect is analogous to transferring water along space. Indeed, trading food is a convenient solution instead of trading water. For water-scarce countries it can sometimes be attractive to import virtual water (through import of water-intensive products), thus relieving the pressure on the domestic water resources. This happens, for example, in Mediterranean countries, the Middle East and Mexico. Northern European countries import a lot of water in virtual form (more than they export), but this is not driven by water scarcity. An estimate of the main global fluxes of virtual water is provided by the map that is available here.
Finally, reacting to and reducing the impact of extreme weather events, such as droughts, floods, and storm surges, is a viable option to reduce water scarcity. Indeed, reducing the amount of freshwater demanded relative to supply, and increasing the amount of water stored, will go a long way towards increasing resilience against highly variable rainfall. Mitigating the damage caused by extreme events will require large investments in technology and infrastructure.
Other important investments include upgrading hydro-meteorological and early-warning systems. Increasing the lead-time of a storm forecast can have tremendous benefits by allowing households to evacuate an area and move their belongings to higher ground. Better medium-term and seasonal forecasts can also help farmers make cropping and irrigating decisions, which can counteract some of the added uncertainty climate change will bring. Nevertheless, forecasts are only useful if users have the ability to understand and incorporate them in decision-making. In some cases this will require building the institutions which have the capacity to transform a forecast into an actionable warning, and can communicate it to the local populations.
Another important, yet under-utilized tool in developing countries for responding to growing rainfall variability is crop insurance. Increasing farmers’ access to crop insurance will not only protect households against falling into poverty or becoming food insecure. It will also incentivize farmers to invest in higher value crops and modern technologies by eliminating the catastrophic risk of losing a large investment if the harvest fails. In 2007, agricultural crop insurance premiums were less 0.3 percent of agricultural GDP in developing countries, significantly less than the 2.3 percent of agricultural GDP found in developed countries. This gap suggests that developing countries are severely underserved, especially when accounting for the fact that rain-fed agriculture, a much riskier venture than irrigated agriculture, is much more common in developing countries.
When water resources management comes to the technical level with the purpose of designing the most proper solution, a key problem is to estimate how much water is available for the purpose. In technical terms, the latter problem is called "water resources assessment".
In fact, water resources systems can be neither developed nor managed rationally without an assessment of the quantity and quality of water available. Water resources assessment (WRA) is a tool to evaluate water resources in relation to a reference water resources systems. To make reference to a "system" is essential in the technical context of engineering to identify and design a solution. In particular, in WRA engineers need to make reference to a dynamical system defined as "particle or ensemble of particles whose state varies over time and thus obeys differential equations involving time derivatives." In our case the "ensemble of particles" is given by a volume of water, while differential equations are conditioned by constraints as well as initial and boundary conditions which are largely technical. In order to make a prediction about the system’s future behavior, an analytical solution of such equations or their integration over a considered domain through computer simulation is realized.
The concept of a dynamical system has its origins in Newtonian mechanics. It is important to note that some components of the dynamical system may be subjected to random variations, which implies the presence of uncertainty in the prediction of the state of the system. This is precisely the case of water resources systems, where the drivers, the initial and boundary conditions, and the nature itself of the system may be affected by randomness.
In WRA the basic question is "how much water is there and what is its quality". It may seem a trivial question but actually it is not. Even for the case of surface water, which is relatively easier, it is a challenging task to estimate the volume of water that may be available for human use. Fresh water resources are available in the form of surface water or groundwater. Surface water is available in rivers and lakes, and to a minor extent in the form of ice and snow. The difference between rivers and lakes is essentially given by the velocity of the water flow, which is markedly higher in rivers and therefore their recharge is quicker. Groundwater is available in artesian (also called confined) and phreatic (or unconfined) aquifers (Figure 10 and 11).
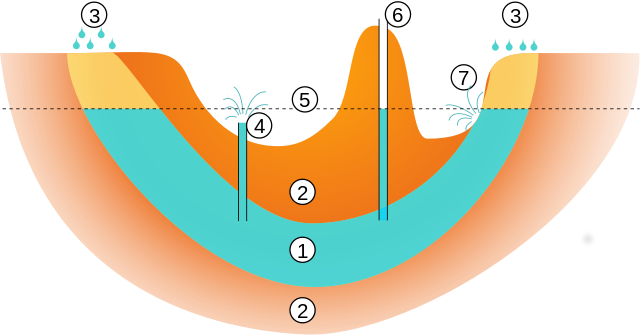
Figure 10. Artesian aquifer. CC BY-SA 2.5, https://commons.wikimedia.org/w/index.php?curid=1234548.
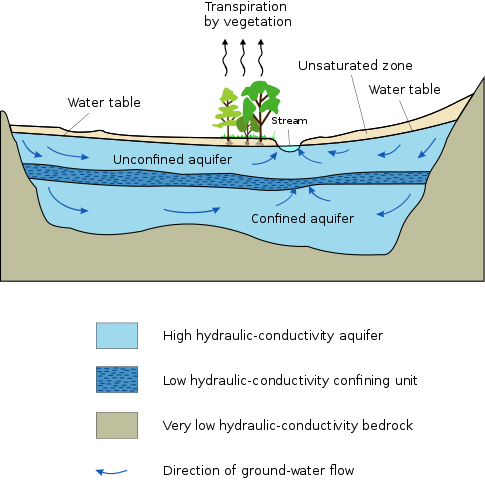
Figure 11. Artesian and phreatic aquifer. By © Hans Hillewaert /, Public Domain, https://commons.wikimedia.org/w/index.php?curid=2152154.
An < href=https://en.wikipedia.org/wiki/Artesian_aquifer target=_blank>artesian aquifer is a confined aquifer containing groundwater under positive pressure. An artesian aquifer is trapped water, surrounded by layers of impermeable rocks or clay, which applies positive pressure to the water contained within the aquifer. A phreatic aquifer has the water table (or phreatic surface) as upper boundary. The functioning of aquifers is described this video by GeoScience Videos.
In order to assess the volume of water that is available in any water body - no matter if superficial or subsuperficial - monitoring is essential. It is easier to monitor surface water than groundwater, for obvious reasons. Monitoring may refer to a point in space or to a region. Traditional monitoring is usually local, while modern technologies like meteorological radars and satellite allow for distributed monitoring. Another classification is based on the temporal resolution of monitoring. Monitoring may be to a single time, and therefore the result is a snapshot, or may be continuous in time, with given time resolution or time step. Continuous time monitoring is definitely more useful as it gives a dynamic representation of the status of the water body.
Continuous time monitoring typically delivers a time series, namely, a series of observations of the considered variable listed in chronological order. Examples of variables that may be monitored are:
- river discharge, namely, the volumetric flow rate of water that flows through a given cross-section of the river at a given time.
- Groundwater level.
- Rainfall intensity at a given location.
- Temperature at a given location,
and so forth.
The time span during which the time series was observed is termed "observation period". When it is sufficiently long, often the sole analysis of the time series allows the engineer to estimate how much water is available for withdrawal from the river or storage, through an inductive analysis. The design of storage infrastructures (dams) and/or water withdrawal and management is a complex procedure. In particular, one has to predict the impacts of the water storage/withdrawal and check whether these impacts are sustainable.
Figure 12 shows a 3-D representation of the Po River (Italy) flow observed at Pontelagoscuro (close to the city of Ferrara) from 1920 to 2009. To obtain a clear representation the resulting surface was smoothed. 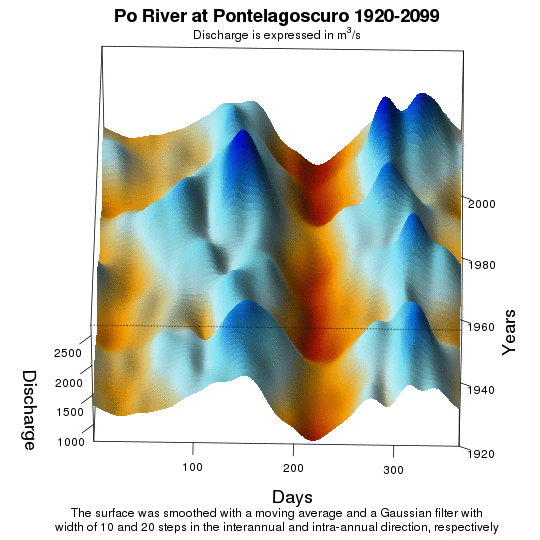
Figure 12. 3D representation of the Po River daily discharge time series (1920-2009). The resulting surface was smoothed by applying a moving average and a Gaussian filter. From A. Montanari, Hydrology of the Po River: looking for changing patterns in river discharge.
Figure 12 shows that the dynamics of river flow is indeed complex. The seasonal regularity can be clearly seen, as well as singularities in the interannual direction that are extended well beyond the filter width. In particular, the summer drought is clearly exacerbated in the recent period, but a similar local perturbation occurred from 1940 to 1960, when a prolonged situation of water scarcity occurred that is well remembered by the elder population. The singularity arising from the occurrence of two major floods in 1994 and 2000 is visible as well. It is interesting to note the presence of other singularities. For instance, the spring peak occurring around the end of March was more pronounced in the years from 1950 to 1980 approximately, while it is less evident in recent years. Overall, one can see that the discharge time series of the Po River at Pontelagoscuro is affected by long term natural cycles that significantly affect distribution and temporal variability of water resources. This situation is compatible with the presence of long-term persistence, which in hydrology is also called ''Hurst-Kolmogorov behaviour'', for which a convincing physical interpretation was not yet provided.
When sufficiently long time series are not available, water resources can be assessed by using deductive methods, which make use of water balance. The latter uses the principles of conservation of mass in a closed system, whereby any water entering a system (for instance via precipitation) either contributes to fluxes like, for instance, evaporation, river discharge, or is stored in water bodies.
Water resources assessment is also instrumental to climate change analysis, for instance through trend analysis.
Water resources assessment is completed by water quality assessment, which can also be carried out through inductive or deductive methods. It is important to point out once again that observations are imprecise and therefore affected by uncertainty, which needs to be taken into account in the engineering design.
Blöschl, G., A. Viglione, and A. Montanari, 2013: Emerging Approaches to Hydrological Risk Management in a Changing World. Climate Vulnerability: Understanding and Addressing Threats to Essential Resources. Elsevier Inc., Academic Press, 3–10. ISBN: 9780123847034. Dessai, S., and M. Hulme, 2004: Does climate adaptation policy need probabilities? Clim. Policy, 4, 107–128. Wilby, R. L., and S. Dessai, 2010: Robust adaptation to climate change. Weather, 65 (7), 180–185. World Bank. 2016. “High and Dry: Climate Change, Water, and the Economy.” World Bank, Washington, DC. License: Creative Commons Attribution CC BY 3.0 IGO FAO. 2016. AQUASTAT website. Food and Agriculture Organization of the United Nations (FAO). Website accessed on May 18, 2017.
Download the powerpoint presentation of this lecture
Last updated on January 15, 2019
- 1243 views